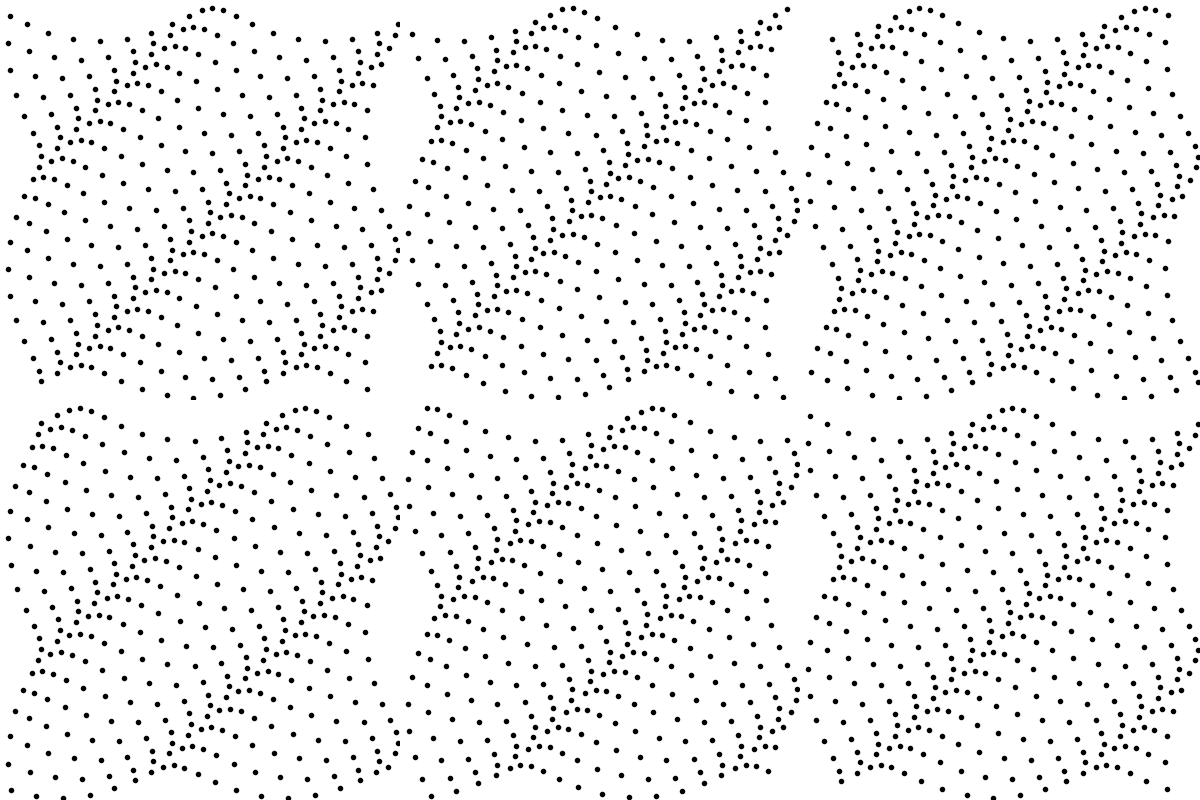
Wave circles
A while ago I saw this nice animation (not sure what is the original source, but it can be found in different places on the web) demonstrating a propagation of what seems like a compression wave composed only from the rotation of black dots on closely placed circles, creating the illusion of a wave form with an amplitude perpendicular to the direction of motion (a transverse wave).
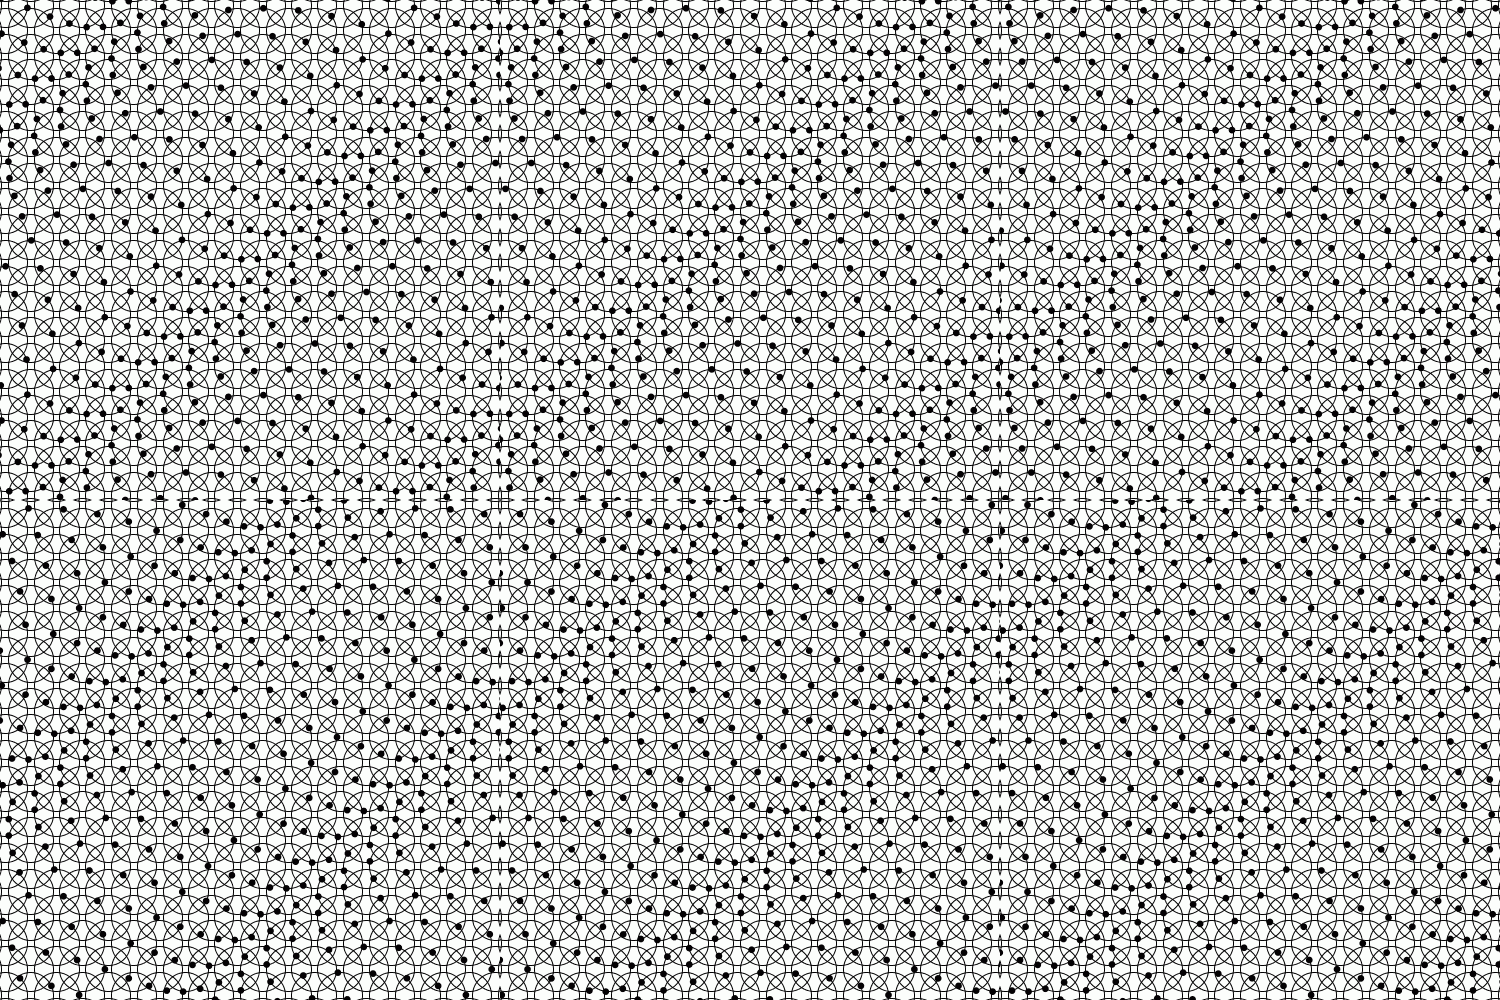
Recently I saw it again, and decided to check if I can reproduce it and try to better understand how the effect is generated. So after examining more carefully the image, you see that there are equally spaced circles, intersecting each other, with a black dot on the perimeter which is rotating with a constant angular velocity in all the circles. Further, one can see that in each consecutive circle, the black dot is slightly shifted in its path around the circle. So how does this result in a propagating wave effect? A longitudinal plane wave in 2D can be written in the complex representation:
\[A(x,y,t)=A_0e^{i(\omega t -\vec{k}\cdot\vec{r})}\]where $A_0$ is a complex amplitude (real amplitude and phase), $\vec{k}$ is the wave vector, and $\vec{r}$ is position in 2D. This describes a plane wave propagating in the direction $\vec{k}$. At a given position the wave given by $e^{i(\omega t+\phi)}$ is nothing more than a rotation in the complex plane, composed of harmonic motion $cos(\omega t+\phi) , sin(\omega t +\phi)$ along the $x$ and $y$ axes. The position dependence is given by the wave vector components.
With this in mind, I managed to generate such an animation in Mathematica using the code below:
n = 20;  (* number of circles per row and column*)
w = 2 Pi/60;  (* angular frequency *)
kx = 2 Pi/15; ky = -2 Pi/15; (* wave vector *)

v = Table[
(* draw a grid of circles of radius 0.115 with separation 0.115 along x and y*)

Panel[Graphics[{{Table[Table[Circle[{(i - 1) 0.115, 0.115 j}, 0.1], {i, 1, n}], {j, 1, n}]},

(* draw black dots on the circles include in the x,y coordinates the time and phase.*)

{Table[Table[Disk[{(i - 1)*0.115 + 0.1*Cos[w t + kx + ky j], 0.115 j +
	0.1*Sin[w t + kx i + ky j]}, 0.017], {i, 1, n}], {j, 1, n}]}},

(* range of the graphics in order for the frame to be fixed, and won't move *)

PlotRange -> {{-0.15, 2.3}, {0, 2.45}}, Background -> White] ],
{t, 0, 2 Pi/w, 2*Pi/w/64}];
 (* the sequence of images set by t, in one period, with 64 frames. *)

Export["cw1.gif", v, "DisplayDurations" -> 0.03,ImageSize -> 400];  (* export to gif *)
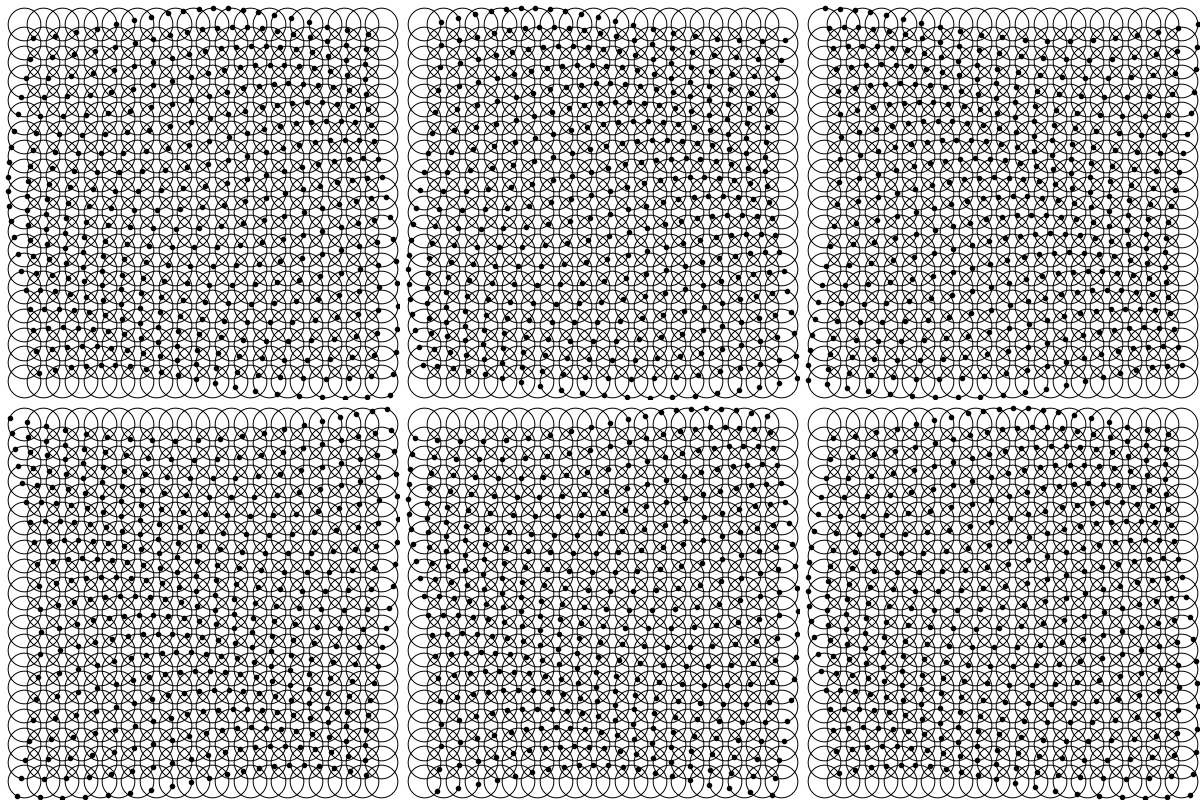
The resulting animation, for the chosen parameters, and especially the chosen wave vector, which points in the direction from top left to bottom right.
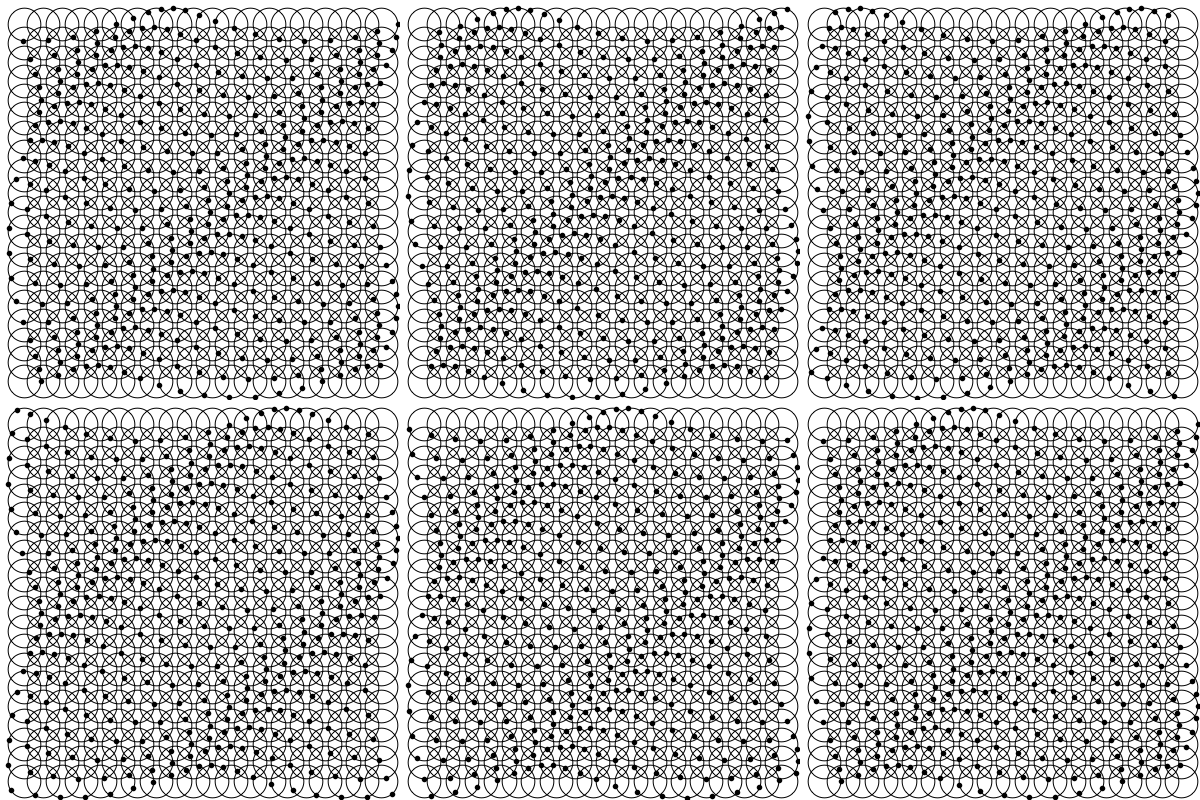
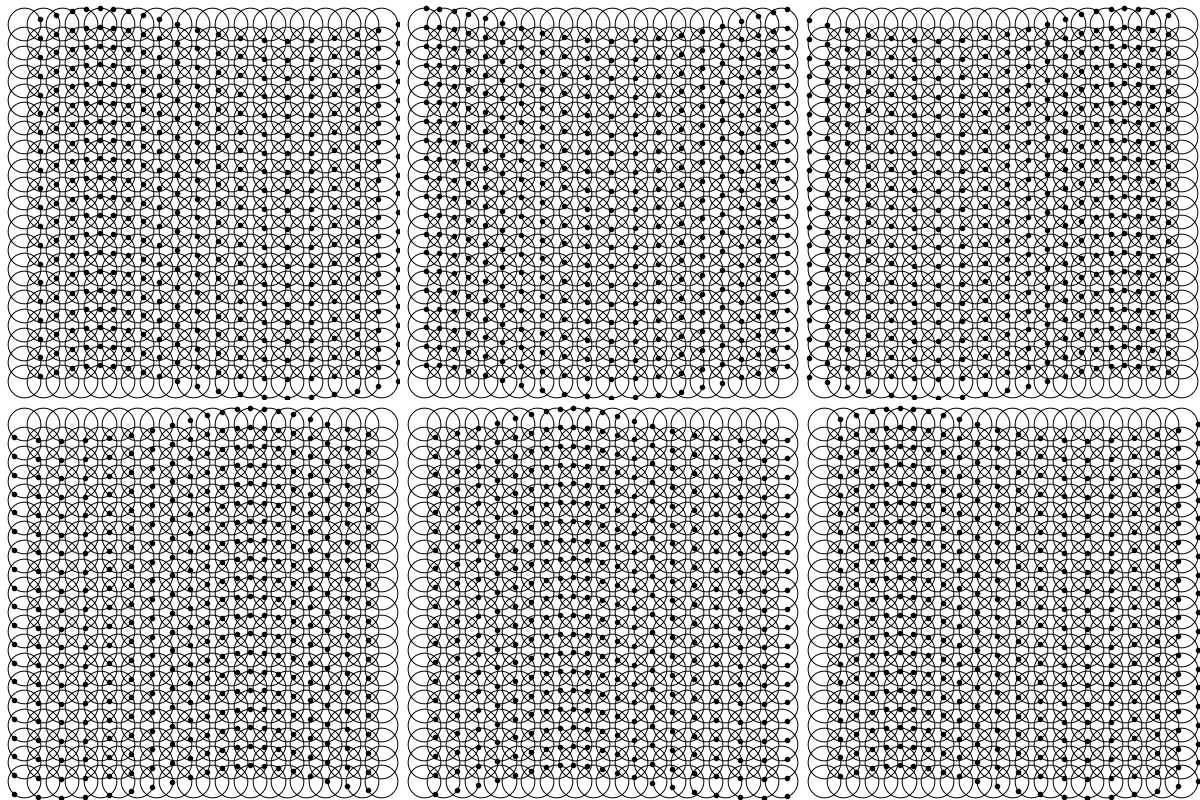
By choosing different values for $k$ we can control both the wavelength (distance between the dark or compressed patches) as well as the direction of propagation.
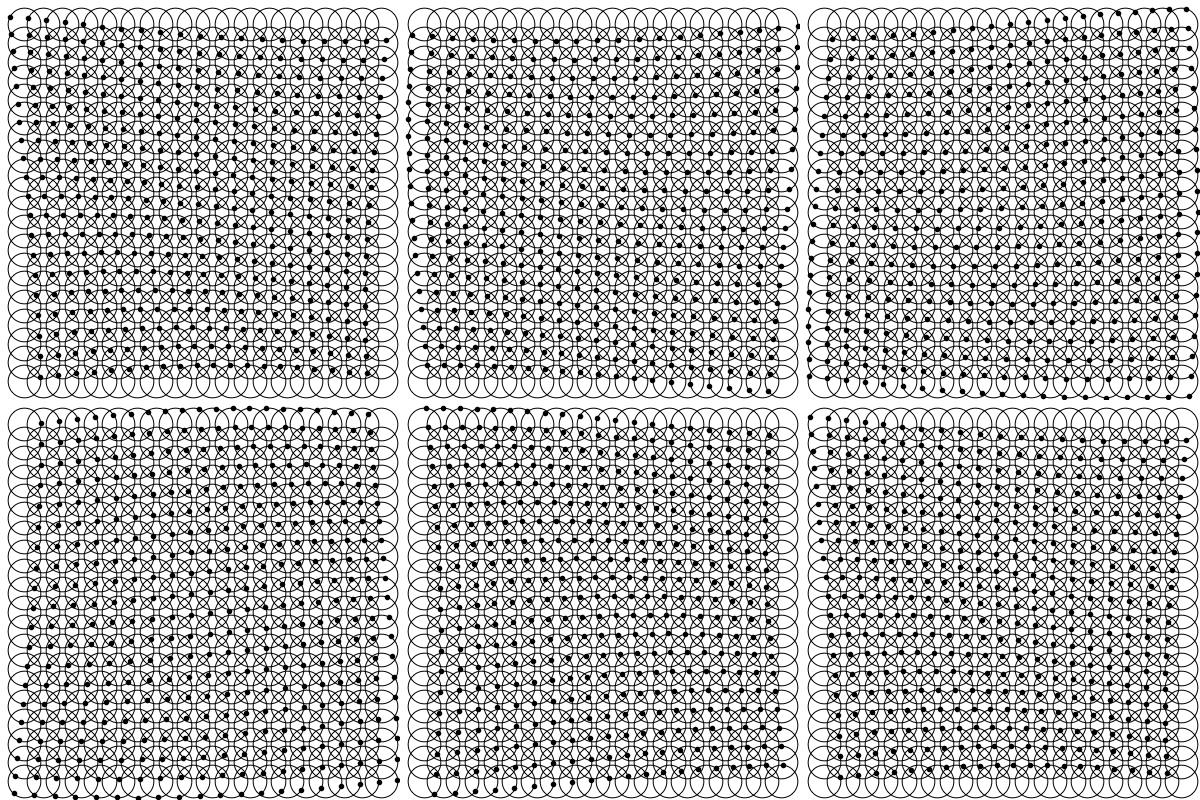
Below I show a few examples:
| $k_x=2\pi/20, k_y=0$ | $k_x=2\pi/20, k_y=2\pi/20$ | $k_x=k_y=2\pi/50$ |
 |
 |
 |
 |
 |
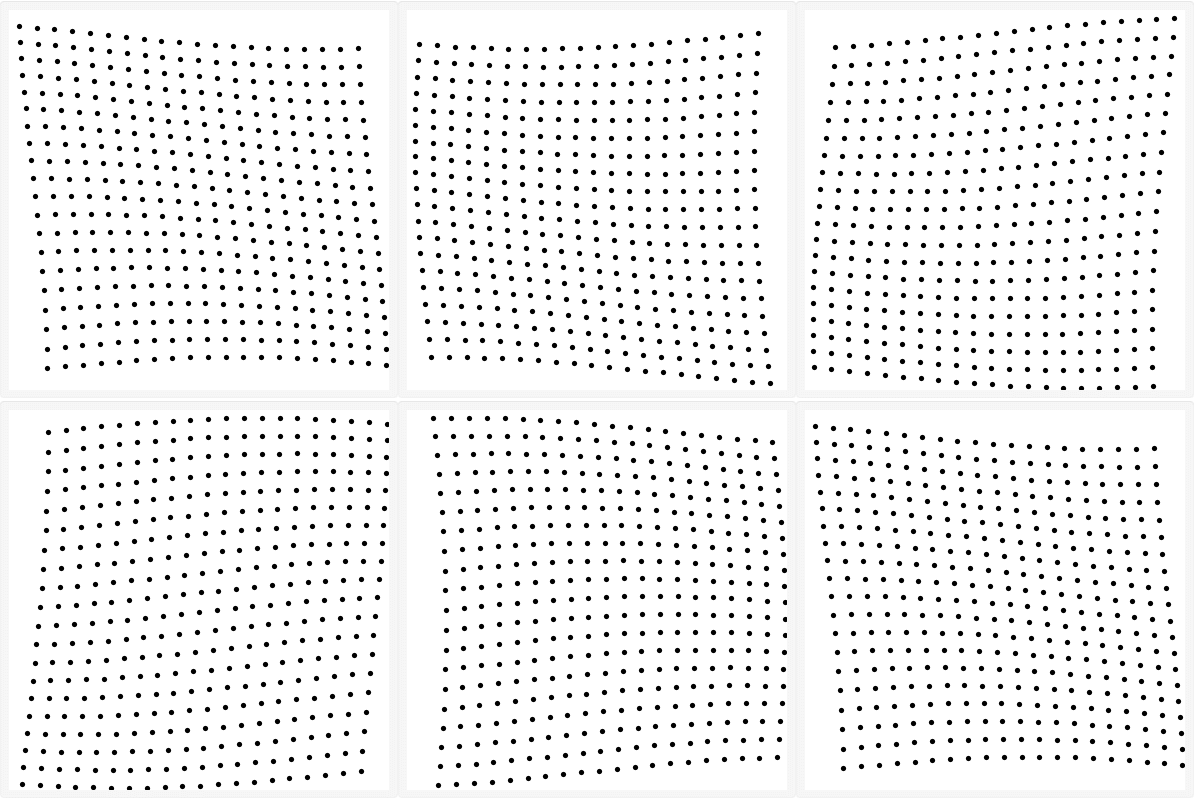 |
We see that the wave vector corresponds indeed to the direction of propagation. If the wavelength ($\lambda=2\pi/k$) is large enough the motion of the black dots looks more in phase, as the wavelength is greater than the size of the sample shown.
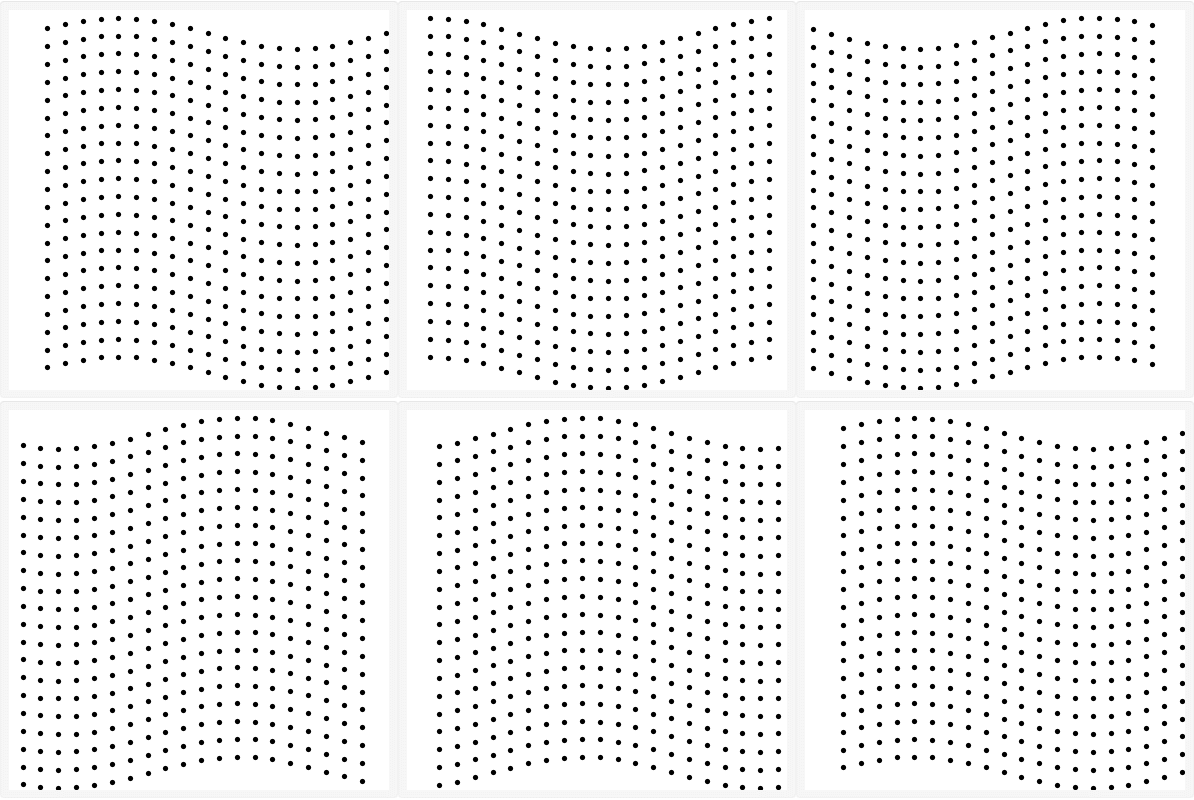
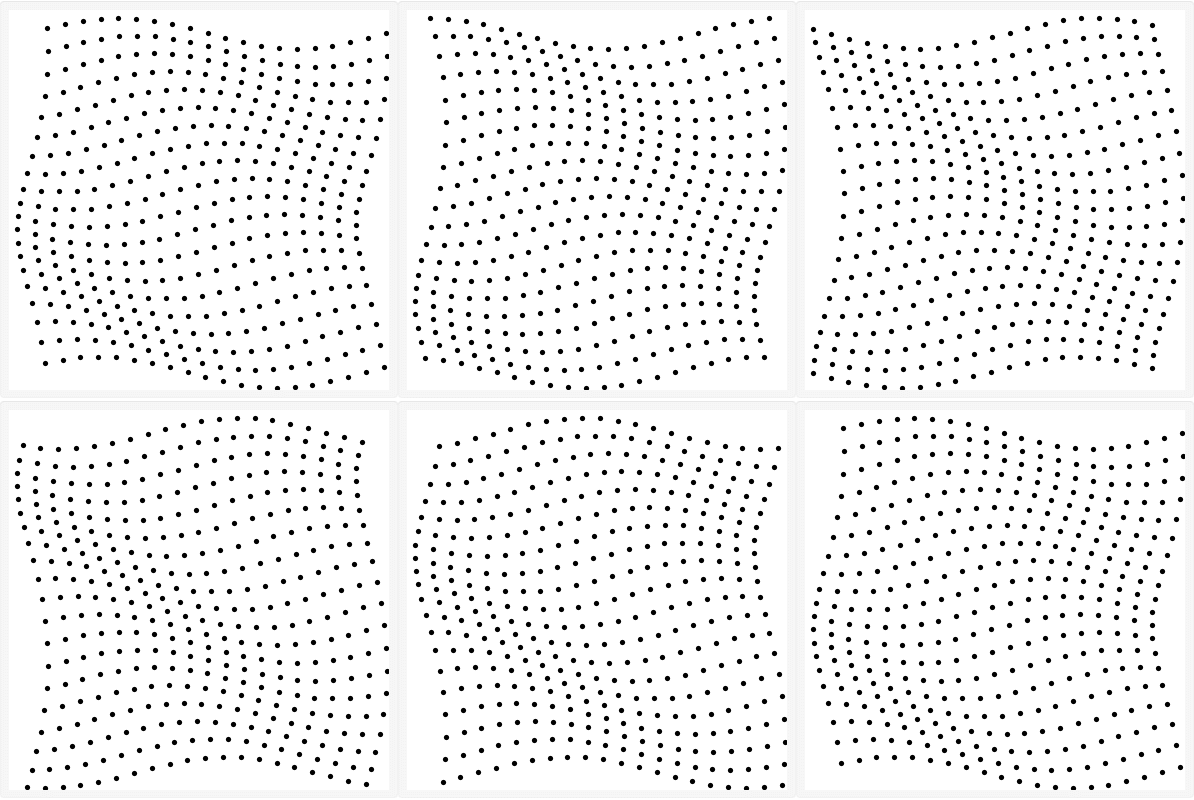
Finally, it is also nice to see this wave pattern by showing only the black dots without the circles, then it’s harder to see that the origin for this motion is in the constant circular motion of the black dots.
